Features

In addition to the analysis and sending of reports and notifications automatically, Terative is a predictive maintenance predictive maintenance platform that has a large number of data visualization and analysis tools for the user. Below are shown some of these tools and other features of the platform.

Asset Dashboard

In this panel, each asset is sorted by priority according to its condition score. From this panel, you can also access more detailed information about each asset.

Asset status

The analysis of the details of each asset and the recent history of its condition can be observed in this panel.

Trend graph

The platform allows to analyze the evolution of up to four variables simultaneously, in a trend graph.

Trend graph II

These graphics are not limited in time, and moving around them generates messages with contextual information.

Spectrograms

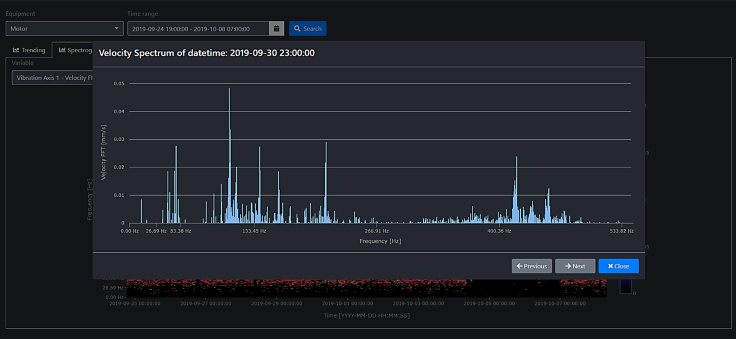
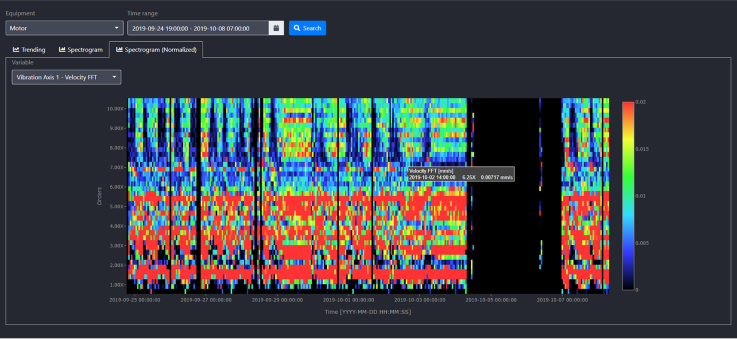
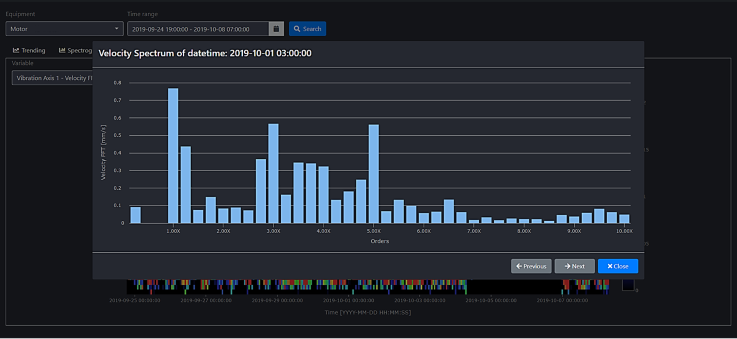
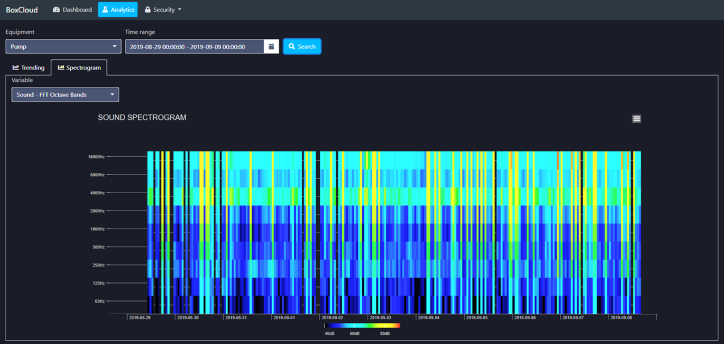
In addition to the trend graphs, the variables that allow it have associated special graphs where the time evolution of the frequency spectra can be observed. This information is of great relevance for the study of possible variations in the functioning of the asset.

Frequency spectra

Another feature of the platform is its ability to analyze the vibration spectrum. By clicking on the spectrogram, you can access the frequency spectrum for a certain moment. These spectra provide useful information for determining the source of a fault.

Normalized spectrograms

Normalized spectrograms are similar to spectrograms, but on the X-axis the spectrum is normalized with respect to the fundamental frequency of the asset.

Normalized spectra

Like normalized spectrograms, normalized spectra are similar to frequency spectra, but on the X-axis the spectra is normalized with respect to the fundamental frequency of the asset.

Sound spectra

These graphs are adjusted to sound variables, so their scale on the Z-axis is logarithmic, and their scale on the Y-axis is developed in octave bands.

Scatter plots

Scatter plots allow anomalies to be detected based on the relationship between variables.